Most citizen scientists are in it to have an impact on society or policy. This goal is reached best when working together – with fellow citizen scientists, or other stake holders. Joining forces also implies joining data. For this at the heart of the Samen Meten infrastructure is the data portal samenmeten.rivm.nl. Here, citizen science sensor data is shared and visualized. The data portal ensures that the sensor data is open, publicly available and easy accessible for further application. Also the software to process or analyze the data is open.
Open data
The Measure Together database is open to everyone that agrees to the principle that the data, the measurement methods and the software are open. This means that the information about the type of sensor is shared and that algorithms used to calibrate and post-process the data of sensors are open; no “black boxes”. Sensor locations are shared on a map, randomly shifted by up to 50 meters every time they are shown, to provide a certain level of privacy.
Communication with the internet
To collect sensor data in a central place via the internet, we use IoT techniques, such as Wi-Fi, LoRa, and Narrowband (NB-IoT). They all have pros and cons. WiFi is inexpensive, LoRa is easy to configure, NarrowBand IoT offers coverage across the Netherlands which makes it suited for rural areas.
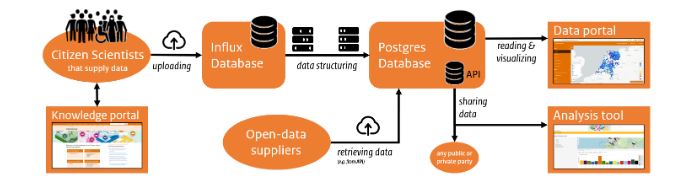
Influx Database to collect third Party data
The sensor data is first collected in an Influx Database, a relatively simple Open-Source database optimized for time series and fast access to the data. The sensor data that come in, use a prior agreed standard terminology for the measured components, units, measurement frequency, etc.
The Influx database is flexible and especially useful for third-party data suppliers. It can be regarded as a pass-through-database that passes the data on to the primary database.
Postgres Database contains all data
The Postgres Database is the primary database that ultimately contains all data. It is an Open-Source relational database. It contains multiple tables with raw data, processed data and metadata. There are e.g. the following tables:
• the actual raw measurement data
• the hourly average measurement data
• the metadata of all individual sensor boxes (where are they located, what type of sensor they contain, who owns it, to which project do they belong)
The Postgres Database also receives data in other ways. For example, it queries various APIs from projects with a substantial number of sensors in the field such as the Sensor.Community API. Sensor.Community has thousands of sensors operational worldwide.
The hourly averages from the Postgress database are visualized at Measure Together data portal.
Visualization on the Data portal
The Measure Together data portal shows sensors as colored dots on the map, with colors based on the most recent hourly averaged sensor value. Data are shown for different quantities such as noise levels (Leq), electric conductivity of water (EC), particulate matter PM10, PM2.5, or nitrogen dioxide NO2. In addition to sensor data, monthly data from passive NO2 samplers are also visualized.
When you click on a dot, the underlying data is shown as a time series plot and sensor data can be compared to the data of the nearest official reference air quality station. Time series data are useful to learn about the variability in air pollution concentrations. You can zoom in to municipal level and compare time series on city or neighborhood level.
Open data through an Application Programming Interface (API)
All sensor data are available for download through an application-programming interface (API).
Analyze Together Tool
The Measure Together data portal shows the actual data for PM sensors on a map and if you click on a dot how data has varied over the past seven days. But often you want to know more. To help citizen scientist to analyze particulate matter data, we have developed the Analyze Together Tool.